Ever felt like you’re flying blind in the cloud? With Azure Monitor, Microsoft hands you the ultimate dashboard to track, analyze, and optimize every heartbeat of your Azure environment—effortlessly.


What Is Azure Monitor and Why It Matters

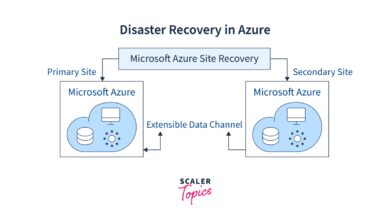
Azure Monitor is Microsoft’s comprehensive observability platform designed to collect, analyze, and act on telemetry from both cloud and on-premises environments. It’s the central nervous system for monitoring applications, infrastructure, and services running on Microsoft Azure.
Whether you’re managing a single virtual machine or a complex microservices architecture, Azure Monitor gives you real-time insights into performance, availability, and operational health. It’s not just about detecting problems—it’s about preventing them before they impact users.
As organizations increasingly migrate to the cloud, the need for robust monitoring tools has never been greater. According to Microsoft, over 95% of Fortune 500 companies use Azure, making Azure Monitor a critical tool for enterprise-grade observability. You can learn more about its official capabilities on the Microsoft Azure Monitor documentation page.
Core Components of Azure Monitor
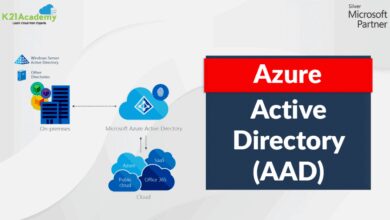
Azure Monitor isn’t a single tool—it’s a suite of integrated services working together to deliver full-stack monitoring. Understanding its components is key to leveraging its full power.
Metrics: Numerical values collected at regular intervals, ideal for tracking performance trends like CPU usage or request rates.Logs: Rich, structured data stored in Log Analytics workspaces, enabling deep troubleshooting and complex queries using Kusto Query Language (KQL).Application Insights: A powerful extension for monitoring live applications, especially useful for developers tracking exceptions, dependencies, and user behavior.Activity Logs: Track administrative actions and system events across your Azure resources, crucial for auditing and compliance.Alerts: Proactive notifications triggered when specific thresholds or patterns are detected, ensuring rapid response to incidents.”Azure Monitor provides a unified platform for collecting, analyzing, and acting on telemetry from your applications and infrastructure.” — Microsoft Azure DocumentationHow Azure Monitor Fits into Modern DevOpsIn today’s DevOps-driven world, speed and reliability go hand in hand..
Azure Monitor bridges the gap between development and operations by providing shared visibility into system performance..
Teams can use Azure Monitor to implement continuous monitoring as part of CI/CD pipelines. For example, Application Insights can detect performance regressions immediately after a deployment, allowing teams to roll back quickly if needed.
Moreover, integration with Azure DevOps and GitHub enables automated incident tracking and root cause analysis. This alignment ensures that monitoring isn’t an afterthought—it’s baked into the development lifecycle.
Setting Up Azure Monitor: A Step-by-Step Guide
Getting started with Azure Monitor might seem daunting, but the setup process is streamlined and intuitive. Whether you’re monitoring a simple web app or a hybrid cloud environment, the foundational steps remain consistent.
The first step is creating a Log Analytics workspace—the central repository where all your log data will be stored and queried. From there, you can enable monitoring for various resources, configure data collection, and set up alerts.
Microsoft provides templates and quick-start guides to accelerate deployment. For detailed instructions, visit the official guide to creating a Log Analytics workspace.
Creating a Log Analytics Workspace
The Log Analytics workspace is the backbone of Azure Monitor’s logging capabilities. All log data—whether from VMs, containers, or applications—flows into this workspace.
To create one, navigate to the Azure portal, search for “Log Analytics workspaces,” and click “Create.” You’ll need to specify a subscription, resource group, region, and workspace name. Once deployed, it becomes the destination for all your telemetry data.
It’s recommended to organize workspaces by environment (e.g., dev, staging, production) or by department for better access control and cost management. Each workspace operates independently, so data isolation is maintained.
Enabling Monitoring for Azure Resources
Once your workspace is ready, the next step is enabling monitoring for your resources. Azure simplifies this with built-in diagnostics settings available on most services.
For example, to monitor an Azure Virtual Machine, go to the VM’s settings, select “Monitoring,” then “Diagnostics settings.” Here, you can enable boot diagnostics, guest-level monitoring, and stream metrics/logs to your Log Analytics workspace.
Similarly, for App Services, you can enable application logging, web server logging, and failed request tracing. These logs are automatically sent to the workspace, where they can be queried and visualized.
For non-Azure resources, such as on-premises servers or AWS instances, you can use the Azure Monitor Agent (AMA), which replaces the older Log Analytics and Dependency agents. The AMA supports cross-platform monitoring and is available for Windows and Linux.
Data Collection: Metrics vs. Logs vs. Traces
Understanding the different types of telemetry data is crucial for effective monitoring. Azure Monitor handles three primary data types: metrics, logs, and traces—each serving a unique purpose.
Metric data is lightweight and ideal for real-time dashboards and alerts. Logs provide deep, contextual information for forensic analysis. Traces, often collected via Application Insights, offer end-to-end visibility into request flows across distributed systems.
Choosing the right data type—and knowing when to use each—is key to building an efficient monitoring strategy without incurring unnecessary costs.
Understanding Metrics in Azure Monitor
Metrics in Azure Monitor are numerical measurements collected at regular intervals (typically every 1 minute or 15 seconds for high-frequency metrics). They are stored in a time-series database optimized for fast retrieval and aggregation.
Common examples include:
- CPU percentage on a virtual machine
- HTTP 5xx error rates for an API
- Disk queue length on a storage account
You can view metrics in the Azure portal, create custom charts, and pin them to dashboards. Metrics are also the foundation for metric alerts, which trigger based on thresholds (e.g., CPU > 90% for 5 minutes).
One powerful feature is multi-dimensional metrics, which allow you to slice and dice data by attributes like location, instance, or status code. This enables granular analysis—for example, identifying which region is experiencing high latency.
Working with Logs and Kusto Query Language (KQL)
Logs in Azure Monitor are far more detailed than metrics. They capture events, errors, and custom messages, providing context that metrics alone cannot offer.
All log data is stored in a Log Analytics workspace and queried using Kusto Query Language (KQL), a powerful and flexible language designed for big data analytics.
For example, to find all failed login attempts in the last 24 hours, you might run:
SecurityEvent | where EventID == 4625 | where TimeGenerated > ago(24h)
KQL supports filtering, aggregation, joins, and even machine learning functions. Its syntax is intuitive, making it accessible even to non-developers after some practice.
Microsoft offers a free interactive KQL tutorial to help users get up to speed quickly.
Tracing and Distributed Application Monitoring
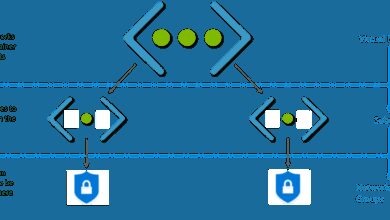
In modern microservices architectures, a single user request can traverse multiple services. Traditional monitoring tools often fail to connect these dots. This is where distributed tracing comes in.
Azure Monitor Application Insights automatically captures traces—also known as requests and dependencies—across services. You can visualize the entire call flow in the Application Map, which shows how services interact and where bottlenecks occur.
For example, if an API call is slow, you can drill down into the trace to see whether the delay happened in the database, a third-party API, or internal processing. This end-to-end visibility drastically reduces mean time to resolution (MTTR).
Tracing works out of the box for .NET, Java, Node.js, and Python applications. For other platforms, you can use OpenTelemetry, an open standard supported by Azure Monitor.
Alerting and Incident Management with Azure Monitor
Monitoring without action is like having smoke detectors that don’t beep. Azure Monitor’s alerting engine ensures you’re notified the moment something goes wrong—or is about to go wrong.
Alerts can be based on metrics, logs, activity logs, or even AI-driven anomaly detection. They can trigger emails, SMS, webhooks, or integrate with ITSM tools like ServiceNow and PagerDuty.
The key is setting up smart alerts that reduce noise and focus on actionable insights. Too many false positives lead to alert fatigue, where teams start ignoring notifications.
Creating Metric and Log Alerts
Azure Monitor supports two main types of alerts: metric alerts and log alerts.
Metric alerts are simple and efficient. You define a metric (e.g., CPU usage), a threshold (e.g., >80%), and a duration (e.g., for 5 minutes). When the condition is met, an alert fires.
Log alerts are more flexible but resource-intensive. They run scheduled queries against log data. For example, you might create a log alert that triggers when more than 10 exceptions occur in your application logs within 5 minutes.
Log alerts are priced based on the volume of data scanned and the frequency of evaluation, so it’s important to optimize queries and avoid overly broad scans.
You can manage alerts through the Azure portal, PowerShell, CLI, or ARM templates. For best practices, refer to Microsoft’s alerting best practices guide.
Using Smart Detection and AI-Powered Insights
One of Azure Monitor’s most innovative features is Smart Detection, which uses machine learning to identify anomalies without predefined thresholds.
For example, it can detect sudden spikes in failure rates, unusual patterns in response times, or memory leaks that develop slowly over time. These insights are surfaced as proactive notifications in the Azure portal.
Smart Detection doesn’t replace traditional alerts—it complements them. While static thresholds catch known issues, AI-driven detection uncovers unknown unknowns.
Currently, Smart Detection is available for Application Insights and supports scenarios like:
- Failure Anomalies: Detects unexpected increases in exception rates.
- Performance Anomalies: Flags slow response times or dependency delays.
- Memory Dump Analysis: Identifies potential memory leaks in .NET applications.
These insights are invaluable for preventing outages before users are affected.
Integrating with ITSM and Automation Tools
Alerts are only useful if they lead to action. Azure Monitor integrates seamlessly with incident management and automation platforms.
For example, you can configure an alert to automatically create a ticket in ServiceNow or trigger a runbook in Azure Automation to restart a failed service.
Webhooks allow integration with custom applications or chatops tools like Microsoft Teams or Slack. You can send alert notifications directly to a channel, enabling faster team collaboration.
Additionally, Azure Monitor integrates with Azure Action Groups, which let you define reusable sets of actions (e.g., email + SMS + webhook) and apply them across multiple alerts.
Visualizing Data with Dashboards and Workbooks
Data is only as good as your ability to understand it. Azure Monitor provides powerful visualization tools to turn raw telemetry into actionable insights.
From customizable dashboards to interactive Workbooks, you can create rich, real-time views of your system’s health tailored to different stakeholders—developers, operations teams, or executives.
Building Custom Dashboards in the Azure Portal
Azure dashboards allow you to combine metrics, logs, and alerts into a single view. You can pin charts, lists, and KQL query results from Azure Monitor and other services.
For example, a DevOps team might create a dashboard showing:
- Application error rates over time
- Top 10 slowest database queries
- Active alerts and their status
- Deployment history from Azure DevOps
Dashboards are shareable and can be role-based, ensuring that users only see what’s relevant to them. You can also export dashboards as JSON for version control or backup.
To get started, go to the Azure portal, click “Dashboard,” and select “New Dashboard.” Then, use the “Add” button to include tiles from Azure Monitor.
Creating Interactive Reports with Azure Workbooks
Azure Workbooks go beyond static dashboards. They are interactive, narrative-driven reports that combine text, queries, visualizations, and parameters.
Workbooks are ideal for creating runbooks, post-mortem analyses, or executive summaries. For example, you could build a workbook that lets a user select a date range and service, then automatically displays performance trends, error logs, and related alerts.
Workbooks support rich formatting, including markdown, images, and HTML. They can be exported to PDF or shared via link, making them perfect for documentation and collaboration.
You can create a new workbook from the Azure Monitor menu or from within a Log Analytics workspace. Microsoft provides dozens of built-in templates for common scenarios like VM health, network monitoring, and cost analysis.
Sharing and Collaborating on Monitoring Insights
Effective monitoring is a team sport. Azure Monitor supports collaboration through shared workspaces, dashboards, and workbooks.
Using Azure Role-Based Access Control (RBAC), you can grant granular permissions—e.g., read-only access to logs for auditors, or edit rights to dashboard owners.
You can also export workbook templates and share them across subscriptions or organizations. This promotes consistency in monitoring practices and reduces duplication of effort.
For teams using Microsoft 365, integrating Azure Monitor alerts with Teams channels ensures that the right people are notified in real time, right where they collaborate.
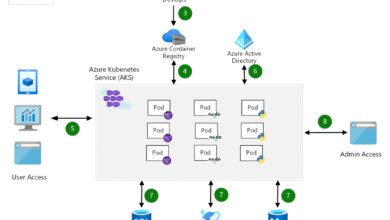
Advanced Scenarios: Custom Metrics, Logs, and APIs
While Azure Monitor excels at monitoring Azure-native services, its true power lies in extensibility. You can monitor custom applications, on-premises systems, and third-party services with ease.
Through APIs and SDKs, you can send custom telemetry, create synthetic transactions, and even build your own monitoring solutions on top of Azure Monitor.
Sending Custom Metrics and Logs
Sometimes, built-in metrics aren’t enough. You might want to track business KPIs like “orders processed” or “user signups.” Azure Monitor allows you to send custom metrics and logs programmatically.
Using the Application Insights SDK, you can instrument your code to capture custom events:
telemetryClient.TrackEvent("UserSignup");
telemetryClient.TrackMetric("OrdersProcessed", 123);
For non-.NET applications, SDKs are available for Java, JavaScript, Python, and Node.js. You can also use the HTTP Data Collector API to send data directly to Log Analytics from any system.
This flexibility makes Azure Monitor suitable not just for IT operations, but for business intelligence and product analytics as well.
Using Synthetic Transactions and Availability Tests
Just because your app is running doesn’t mean it’s working. Availability tests—also known as synthetic transactions—simulate user interactions to verify that critical workflows are functional.
In Azure Monitor, you can create multi-step web tests that navigate through your application, log in, and perform actions. These tests run from global locations every 5–15 minutes, giving you a real-user perspective on uptime.
If a test fails, Azure Monitor generates an alert and captures a screenshot and error details. This is especially useful for detecting issues that don’t crash the app but degrade the user experience.
You can also set up URL ping tests for simple endpoints. These are lightweight and ideal for monitoring APIs or public websites.
Automating Monitoring with Azure Monitor APIs
For large-scale or automated environments, managing monitoring through the portal isn’t practical. Azure Monitor provides REST APIs and SDKs to automate configuration and data retrieval.
You can use the Metrics API to pull performance data into external dashboards, the Logs API to run KQL queries programmatically, and the Alerts API to manage alert rules at scale.
For example, a CI/CD pipeline could use the Alerts API to temporarily disable non-critical alerts during a deployment window, then re-enable them afterward.
These APIs are essential for organizations practicing Infrastructure as Code (IaC). You can define monitoring configurations in ARM templates or Terraform scripts, ensuring consistency across environments.
Cost Optimization and Best Practices for Azure Monitor
With great power comes great responsibility—and cost. Azure Monitor is feature-rich, but improper usage can lead to unexpectedly high bills, especially from log ingestion and retention.
Understanding pricing models and implementing best practices is crucial for maintaining observability without breaking the bank.
Understanding Azure Monitor Pricing Model
Azure Monitor pricing is based on several factors:
- Log Ingestion: Charged per GB of data ingested into Log Analytics.
- Log Retention: Beyond the first 31 days, additional retention incurs cost.
- Metrics: Most metrics are free, but custom metrics and high-resolution metrics have associated costs.
- Alerts: Metric alerts are free; log alerts are charged based on execution frequency and data scanned.
To manage costs, it’s essential to monitor your usage through the Azure Cost Management tool. You can set up budgets and alerts for Log Analytics spending.
Microsoft recommends starting with a minimal set of logs and expanding only as needed. For example, you might collect verbose logs in production only during incident investigations.
Best Practices for Efficient Monitoring
To get the most out of Azure Monitor while controlling costs, follow these best practices:
- Use Diagnostic Settings: Route logs to different destinations (e.g., Event Hubs for streaming, Storage for long-term archiving) to avoid unnecessary ingestion into Log Analytics.
- Filter Log Data: Use data collection rules to exclude noisy or irrelevant logs (e.g., successful health checks).
- Optimize KQL Queries: Avoid
*searches; filter early withwhereclauses; usesummarizeto reduce result size. - Leverage Built-in Solutions: Use pre-built monitoring solutions like VM Insights or Container Insights instead of building from scratch.
- Set Data Retention Policies: Define appropriate retention periods (e.g., 30 days for dev, 90 days for production) to avoid indefinite storage costs.
Regularly audit your monitoring setup to remove unused workspaces, inactive alerts, and redundant data sources.
Security and Compliance Considerations
Monitoring data often contains sensitive information—user IDs, IP addresses, error messages. Securing this data is critical for compliance with regulations like GDPR, HIPAA, and SOC 2.
Azure Monitor integrates with Azure Security Center and Microsoft Defender for Cloud to provide threat detection and security recommendations.
Enable encryption at rest and in transit. Use private links to secure access to Log Analytics workspaces from public networks. Implement RBAC to ensure least-privilege access.
For highly regulated environments, consider using Customer-Managed Keys (CMK) to control encryption keys. Also, audit access logs regularly to detect unauthorized queries.
What is Azure Monitor used for?
Azure Monitor is used to collect, analyze, and act on telemetry data from cloud and on-premises environments. It helps organizations monitor application performance, infrastructure health, and operational issues, enabling proactive incident response and optimization.
How much does Azure Monitor cost?
Azure Monitor pricing depends on data ingestion, retention, and feature usage. Log ingestion is charged per GB, while most platform metrics are free. Custom metrics, log alerts, and extended retention incur additional costs. You can use the Azure Pricing Calculator to estimate expenses.
Can Azure Monitor monitor on-premises servers?
Yes, Azure Monitor can monitor on-premises servers using the Azure Monitor Agent (AMA) or legacy Log Analytics agent. It supports Windows and Linux machines, allowing centralized monitoring across hybrid environments.
What is the difference between Azure Monitor and Application Insights?
Application Insights is a component of Azure Monitor focused on application performance monitoring (APM). Azure Monitor is the broader platform that includes metrics, logs, alerts, and infrastructure monitoring. Application Insights feeds data into Azure Monitor for unified analysis.
How do I query logs in Azure Monitor?
You query logs in Azure Monitor using Kusto Query Language (KQL) in the Log Analytics workspace. KQL allows filtering, aggregation, joins, and advanced analytics. You can use the query editor in the Azure portal or APIs for automation.
Mastering Azure Monitor is no longer optional—it’s essential for any organization running on Azure. From real-time metrics to AI-driven insights, it provides the tools needed to ensure performance, reliability, and security. By understanding its components, setting up efficient data collection, and leveraging advanced features like Workbooks and Smart Detection, teams can move from reactive firefighting to proactive optimization. With careful cost management and security practices, Azure Monitor becomes not just a monitoring tool, but a strategic asset for digital transformation.
Recommended for you 👇
Further Reading: